E-commerce Operational Analytics — Case Study
Role: Data & Operations Analyst (Personal Project)
Tools: SQL, SQLite, Power BI, Excel
Business Question
The goal of this project was to understand how an e-commerce business is performing across revenue, repeat purchasing, and fulfillment efficiency. I wanted to answer questions such as: Which customers drive the most value? How often do customers return? Where are there bottlenecks in the order and shipping process?
Data & Modeling
I started with a raw e-commerce dataset containing orders, customers, products, and shipping details. I cleaned and standardized the data, then designed a relational schema and loaded everything into a SQLite database using SQL.
The core tables included:
- Customers – customer profiles and regions
- Orders – order dates, revenue, and status
- Order Items – product-level line items
- Shipments – shipping times and fulfillment details
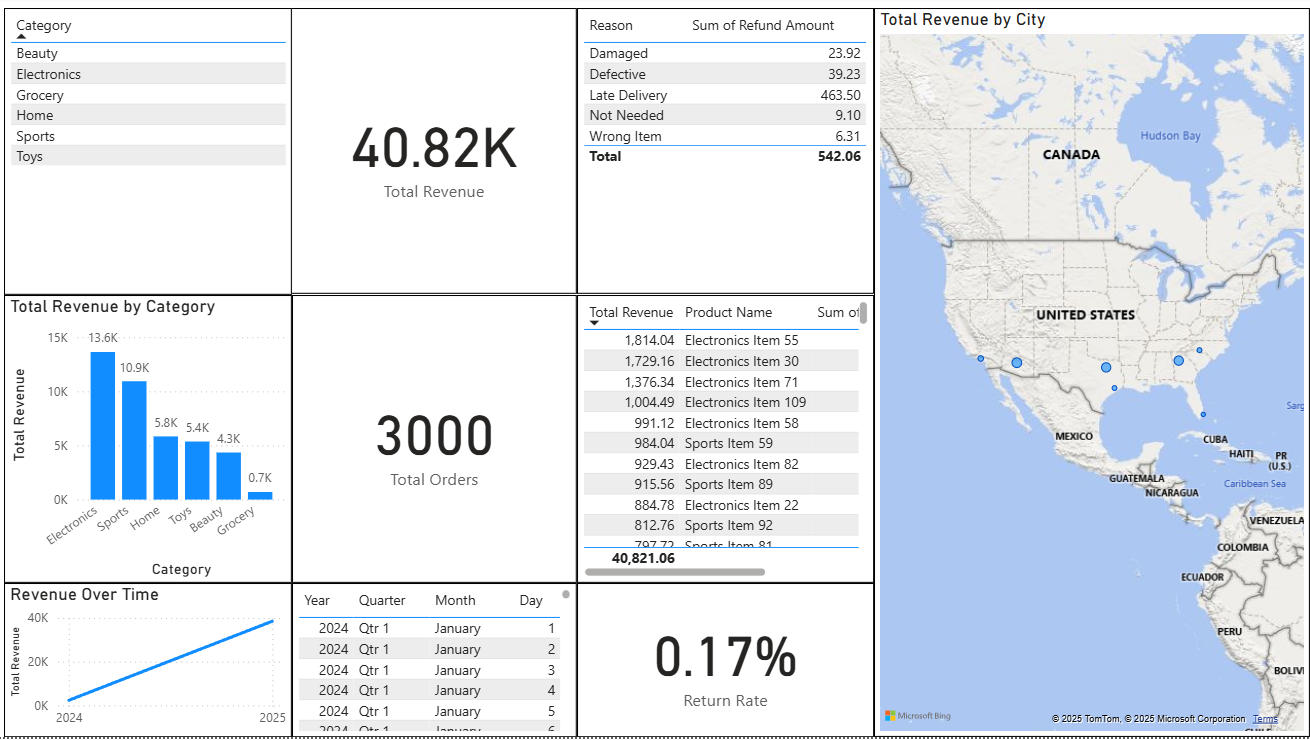
Analysis & KPIs
Using SQL, I calculated and explored a series of metrics to understand performance, then brought the most important ones into Power BI as KPIs and visuals:
- Revenue by product category and region
- Total orders and revenue over time
- Customer order frequency and repeat behavior from SQL queries
- Fulfillment and shipping time across order statuses and regions
These metrics were then visualized in Power BI to make trends, seasonality, and bottlenecks easy to interpret.
Key Insights
- A small segment of repeat customers contributed a disproportionately high share of total revenue, suggesting an opportunity for targeted loyalty or retention campaigns.
- Certain product categories showed strong revenue but lower repeat behavior, indicating potential issues with product quality, pricing, or expectations.
- Orders from specific regions consistently experienced longer fulfillment times, pointing to logistics or warehouse constraints in those areas.
Outcome
This project demonstrates my ability to design a database from raw data, write SQL to generate meaningful KPIs, and turn those into clear operational insights for an e-commerce business. It mirrors the type of performance reporting and process-improvement analysis I’d deliver in an operations or business analyst role.
View the full project on GitHub: Ecommerce-Operations-Analytics